| November 8: Election Day |
|
For 22 years, LatestPollResults.com has offered an unbiased statistically-based probability analysis
to project the odds for each party to win the presidency, control of the Senate, or control of the House.
We use three distinct methods to determine individual race probabilities:
one based on polls, one based on market pricing,
and one based on the qualitative ratings of experts who rate every Senate and House race.
Once we've determined the individual odds for each race, we compute the overall odds for each party by evaluating all possible outcomes.
There are 35 Senate seats up for election this year. Our Senate probability model, The Senate Wizard ℠,
instantly evaluates all 2^35 possible outcomes - over 34 billion and calculates the exact overall probability for each party to win.
Most election-analysis websites opt to run tens or hundreds of thousands of election "simulations" in an attempt to estimate
each party's overall probability of winning.
With the 435 House seats, our probability model, The Wizard of Odds ℠, calculates each party's odds of winning
by evaluating every possible seat distribution from the 2^435 possible outcomes -
over 88 duoquadragintillion, a 131-digit number!
|
 The Senate Wizard ℠ is the ultimate what-if analyzer!
Our unique probability sliders allow you to set your own probabilities for each race.
By default, each probability slider is set to the latest market odds for its race as determined from live pricing data at PredictIt.org.
We update the odds every 5 minutes ... or you can override with your own what-if analysis.
We calculate the odds for the Democrats to control with 51+ seats, the odds for the Republicans to control with 51+ seats, the odds of a 50-50 tie,
and the probability for each seat distribution based on the market-based odds and/or your probabilities.
|
The Senate
Currently, Democrats and Republicans are evenly split in the Senate: 50 Senators caucus with each party. Therefore, Democrats control the Senate as Vice-President Harris casts the tie-breaker.
Of the 35 Senate seats which are up for election this year, 21 will be defended by Republicans and 14 by Democrats;
29 Republicans and 36 Democrats are not up for re-election.
To gain control of the Senate, Republicans will need a net gain of at least one seat, otherwise Democrats will retain control.
Our poll-based method determines the race probabilities for each party's candidate based on the latest poll data for each race.
It has correctly projected the party to control the Senate since 2010, when we began analyzing the Senate.
Here is our poll-based Senate Tracker:
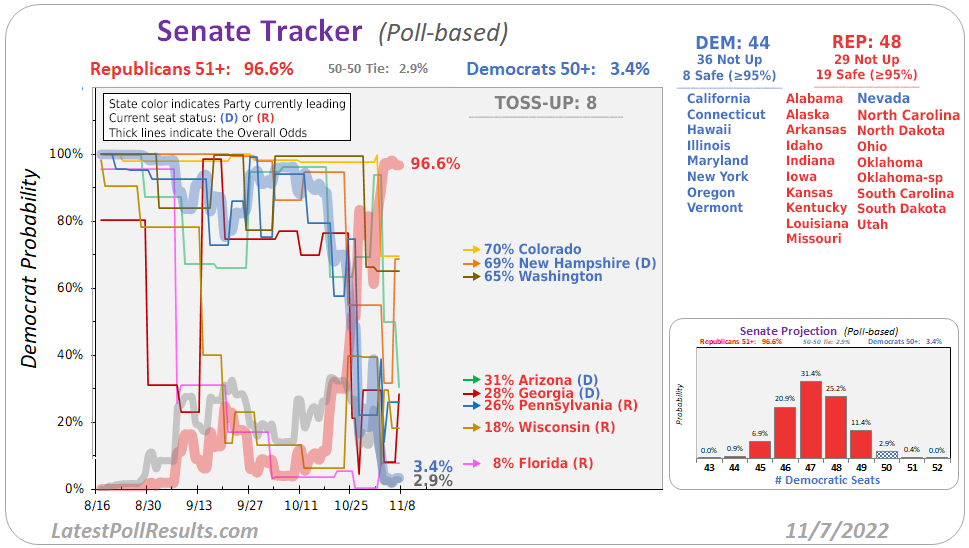 Note: For visual clarity, race odds are rounded to a whole percent and a race where the probability is 95% or greater
for one of the candidates is considered "Safe" for that candidate.
These "Safe" races have been excluded from the graphs. The overall probability projection is determined using unrounded probabilities for all races.
Note: For visual clarity, race odds are rounded to a whole percent and a race where the probability is 95% or greater
for one of the candidates is considered "Safe" for that candidate.
These "Safe" races have been excluded from the graphs. The overall probability projection is determined using unrounded probabilities for all races.
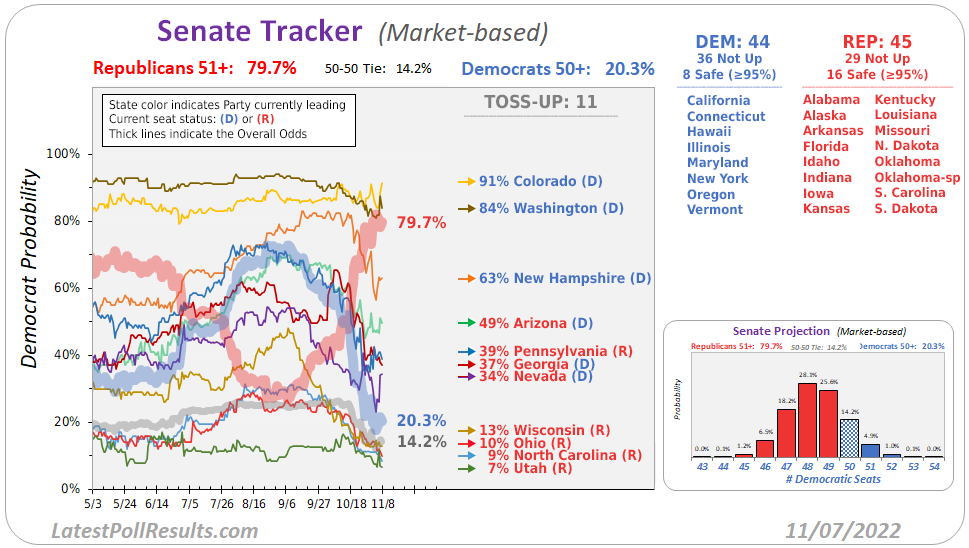
Our market-based method determines the race probabilities for each party based on the latest market contract pricing data for each race on the Predictit.org marketplace.
There are currently 18 Senate races with market contracts at PredictIt.
The remaining 17 Senate races are currently not considered to be competitive and are considered "Safe" for either the Democrat or the Republican.
Here is our market-based Senate Tracker:
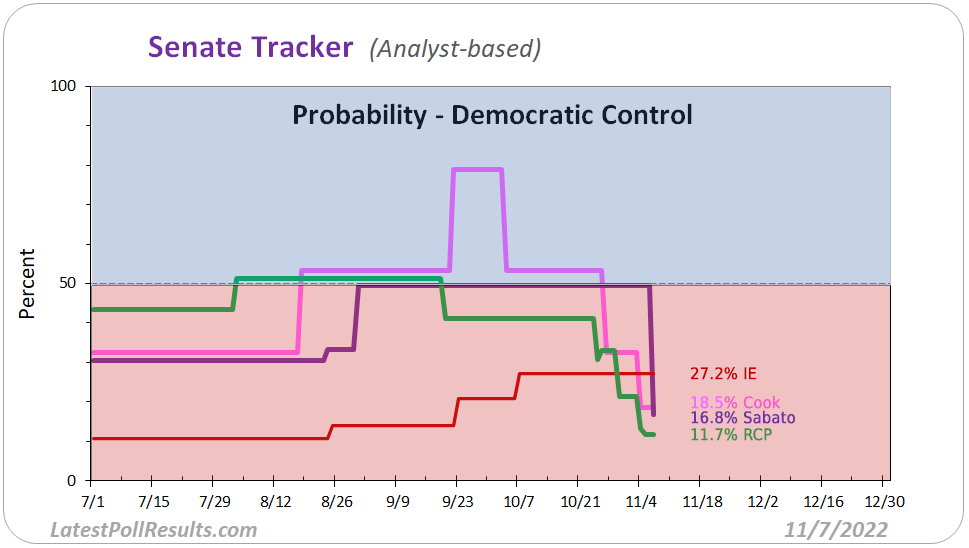
Our analyst-based method uses the qualitative ratings from The Cook Political Report,
Inside Elections,
Sabato's Crystal Ball, and
Real Clear Politics.
These analysts rate every Senate and House seat with a qualitative ratings for either the Democratic or Republican candidate designated as Solid/Safe, Likely, Lean, or Toss-up.
Inside Elections also has a Tilt rating. For each analyst, we assign the probability of winning a seat equal to the historical (2012-2020) accuracy of their qualitative rating.
Here is our analyst-based Senate Tracker since July:
The House
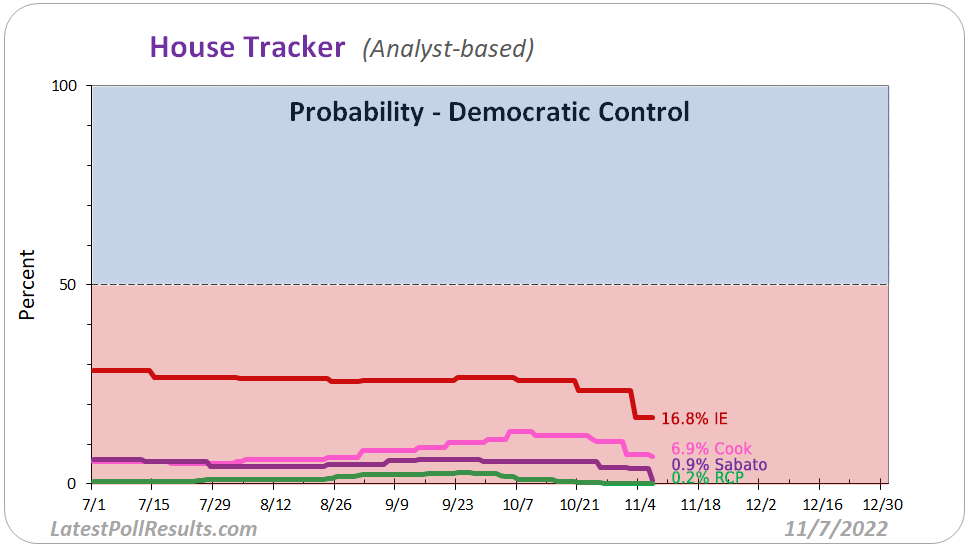
For each House seat, we use as the odds, the historical accuracy for the analyst's qualitative rating.
Some correlation between races exists, particularly among Toss-up races which can produce "blue" or "red" waves.
Our overall House projection adjusts for the variance from the expected results over the indicated election cycles.
Our probability model, The Wizard of Odds ℠ calculates the overall odds for each party to win
by using the odds for each of the 435 races and evaluating the probability of all possible outcomes.
There are 2^435 possible outcomes or over 88 duoquadragintillion.
Here is our analyst-based House Tracker since July:
| |
|