 | |
| 11/02 Summary | |
| Popular Vote | |
| 48.7% | |
| 47.1% | |
| 1.8% | |
| 2.4% | |
| Electoral Vote (270 needed to win) | |
| 188 | |
| 77 | |
| 265 | |
| 153 | |
| 105 | |
| 258 | |
| 15 | |
| Probability of Victory | |
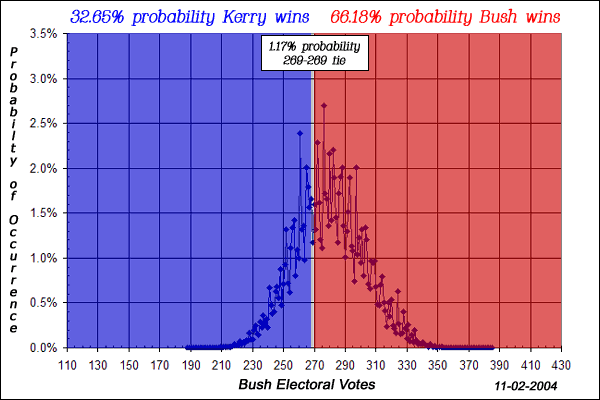
| 66.18% | |
| 32.65% | |
| 1.17% | |
Favorite Links | |
| Real Clear Politics | |
| NowChannel.com | |
| Electoral-Vote.com | |
| DalyThoughts | |
| Race2004.net | |


Latest News: ELECTION DAY 12pm - FINAL TABULATION before polls close.
Nov 02
Observations:
Probability Analysis:
All possible outcomes for the "battleground" states are evaluated.
With 17 "battleground" states, there are 131,072 possible combinations (2^17) of how these states could vote.
Each of these combinations has a specific electoral vote value.
From each state's poll information, specifically, the % for each candidate and the poll's sample size,
we can calculate the statistical probability of victory for each candidate.
The probability of each of the 131,072 possible outcomes is then calculated and grouped by electoral value.
Example:
The most likely possibility for a tie is:
The probability for this scenario is 0.12%
The probability of a 269-269 electoral tie is the sum of the probabilities of each of the 1,538 possible tie scenarios.
Assumptions:
The Popular Vote is determined by taking the latest poll results of each state and weighting the results of each state according to its percentage of the total vote in the 2000 Presidential Election. If a poll does not contain a Nader option in a state where Nader is on the ballot, then for Nader's percentage only, we are using the latest poll where he was an option to derive his percentage of the popular vote.
Contact us with comments or for a customized analysis:

Note: Reuters/Zogby is releasing a daily tracking poll for 10 states that they declare "battleground" states.
As a result, our daily update of the latest poll results almost invariably includes all of these polls since the mid-point of each of these polls is
just 1.5 days from the release date. We will continue to publish the results based on the latest poll results. To introduce some variety in pollsters
and for potentially less volatility in results, we are now also applying our probability model to the polls included in the RCP average for the
"battleground" states designated by Real Clear Politics.
We weight each of the polls by sample size (excluding the occasional poll that does not report a sample size) and compute the probability of a
victory for Bush and Kerry in each of the RCP battleground states. We calculate the probability of an electoral vote victory for Bush, Kerry and a
269-269 tie, assuming that Bush and Kerry win the states that they've been designated to win in the non-battleground states, as determined by
Real Clear Politics. We do this by determining the 2^18 (18 battleground states as of 10-29-04) or 262,144 possible outcomes in the RCP battleground
states and calculating the probability and electoral value for each outcome.
Here are the results:
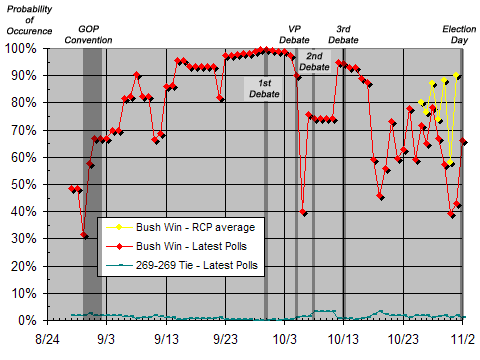
Probability analysis by LatestPollResults.com using Real Clear Politics data Date/Time Bush Win Kerry Win 269-269 Tie 11-02-04 12:01am PST 90.22% 8.36% 1.42% 11-01-04 12:01am PST 58.14% 37.16% 4.70% 10-31-04 12:01am PDT 88.22% 10.15% 1.63% 10-30-04 12:01am PDT 73.88% 23.95% 2.17% 10-29-04 12:01am PDT 87.22% 10.97% 1.81% 10-28-04 12:01am PDT 76.58% 21.73% 1.69% 10-27-04 12:01am PDT 80.24% 18.12% 1.64%
- There are 5 states which have been updated with a more recent poll:
(Includes polls released through 11-2)
The probability of a Bush win moves to 66.18% from 43.08%.
According to the latest poll results ,
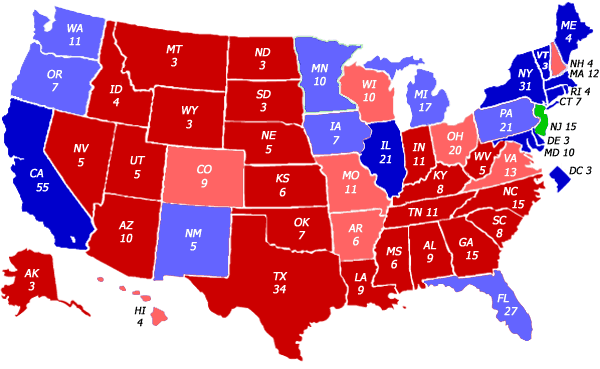
Bush is leading in the same 30 states that he won in 2000 - except for Ohio. Bush is also leading in Hawaii and Wisconsin, both which he lost to Gore in 2000.
Battleground States
2000 Bush
Win %#
EVState
%
Bush %
Kerry %
N/O %
MoE Latest
Poll Pollster
% Probability Win
Bush Kerry
5.44
6 Arkansas
51
46
2*
4.3
10/31 - 11/01
SurveyUSA
88.34
11.66
8.36
9 Colorado
50
47
2*
3.8
10/30 - 11/01
SurveyUSA
79.08
20.92
0.01
27 Florida
48
50
1*
4.0
10/30 - 11/01
ARG
31.03
68.97
-18.33
4 Hawaii
46
45
-*
4.0
10/17 - 10/20
SMS Research
60.23
39.77
-0.31
7 Iowa
47
50
2*
4.4
10/31 - 11/01
SurveyUSA
24.38
75.62
-5.13
17 Michigan
46
52
2*
4.1
10/29 - 11/01
Reuters/Zogby
6.83
93.17
-2.40
10 Minnesota
45
51
2*
4.1
10/29 - 11/01
Reuters/Zogby
6.63
93.37
3.34
11 Missouri
52
47
1*
3.8
10/29 - 10/31
SurveyUSA
90.75
9.25
1.27
4 New Hampshire
49
48
1*
4.0
10/30 - 11/01
ARG
59.82
40.18
-15.83
15 New Jersey
42
42
1*
3.0
10/29 - 10/31
Strategic Vision (R)
50.00
50.00
-0.06
5 New Mexico
48
51
0.5*
4.1
10/29 - 11/01
Reuters/Zogby
23.00
77.00
3.51
20 Ohio
50
47
-*
3.7
10/30 - 10/31
FoxNews/Opinion
79.00
21.00
-0.44
7 Oregon
44
50
1*
4.0
10/26- 10/29
Mason-Dixon
6.06
93.94
-4.17
21 Pennsylvania
48
49
1*
3.9
10/31 - 11/01
SurveyUSA
39.73
60.27
8.04
13 Virginia
51
47
1*
4.1
10/27 - 10/29
SurveyUSA
84.03
15.97
-5.58
11 Washington
45
51
2*
3.0
10/29 - 10/31
Strategic Vision (R)
4.12
95.88
-0.22
10 Wisconsin
48
45
1*
3.7
10/30 - 10/31
FoxNews/Opinion
79.49
20.51
197 Electoral Votes
Bush States
2000 Bush
Win %#
EVState
%
Bush %
Kerry %
N/O %
MoE Latest
Poll Pollster
% Probability Win
Bush Kerry
14.92
9 Alabama
57
39
2*
4.0
10/25 - 10/27
SurveyUSA
100.00
0.00
30.95
3 Alaska
57
30
8*
4.0
9/09 - 9/11
ARG
100.00
0.00
6.29
10 Arizona
56
41
2*
4.1
10/28 - 10/30
SurveyUSA
99.99
0.01
11.69
15 Georgia
55
42
-*
3.0
10/29 - 10/31
Strategic Vision (R)
99.99
0.01
39.53
4 Idaho
59
30
4*
4.0
9/08 - 9/10
ARG
100.00
0.00
15.63
11 Indiana
58
39
2*
4.1
10/27 - 10/29
SurveyUSA
100.00
0.00
20.80
6 Kansas
60
37
3*
3.8
10/25- 10/27
SurveyUSA
100.00
0.00
15.13
8 Kentucky
59
38
1*
4.0
10/28 - 10/30
SurveyUSA
100.00
0.00
7.68
9 Louisiana
58
32
1*
4.0
10/17 - 10/22
SLU
100.00
0.00
16.92
6 Mississippi
51
42
2*
4.0
9/14 - 9/17
ARG
98.92
1.08
25.07
3 Montana
57
36
1*
4.0
10/18 - 10/20
Mason-Dixon
100.00
0.00
28.99
5 Nebraska
61
32
2*
3.1
10/15 - 10/20
Omaha W-H
100.00
0.00
3.55
5 Nevada
53
45
2*
4.0
10/30 - 11/01
SurveyUSA
97.96
2.04
12.83
15 North Carolina
53
45
1*
4.0
10/29 - 10/31
SurveyUSA
97.82
2.18
27.60
3 North Dakota
55
35
2*
4.0
10/18 - 10/21
Minnesota St. U
100.00
0.00
21.88
7 Oklahoma
64
34
1*
3.7
10/28 - 10/30
SurveyUSA
100.00
0.00
15.94
8 South Carolina
54
43
2*
4.0
10/29 - 10/31
SurveyUSA
99.77
0.23
22.73
3 South Dakota
58
46
-*
4.5
10/25
Rasmussen
99.60
0.40
3.86
11 Tennessee
58
40
-*
4.0
10/28 - 10/30
SurveyUSA
100.00
0.00
21.32
34 Texas
59
37
2*
4.1
10/26- 10/28
Survey USA
100.00
0.00
40.49
5 Utah
69
24
3*
2.8
10/21 - 10/28
Dan Jones & Assoc.
100.00
0.00
6.32
5 West Virginia
51
43
-*
4.0
10/26- 10/29
Mason-Dixon
98.08
1.92
40.06
3 Wyoming
65
29
2*
4.0
9/09 - 9/11
ARG
100.00
0.00
188 Electoral Votes Kerry States
2000 Gore
Win %#
EVState
%
Bush %
Kerry %
N/O %
MoE Latest
Poll Pollster
% Probability Win
Bush Kerry
11.80
55 California
43
54
3*
3.6
10/29 - 10/31
SurveyUSA
0.09
99.91
17.47
7 Connecticut
42
52
3*
4.0
10/26 - 10/28
Research 2000
0.55
99.45
13.06
3 Delaware
37.6
45.2
1.3*
3.9
9/22 - 9/25
West Chester U
2.09
97.91
76.20
3 D.C.
11
78
7*
4.0
9/11 - 9/13
ARG
0.00
100.00
12.01
21 Illinois
42
54
3*
3.9
10/27 - 10/29
SurveyUSA
0.07
99.93
5.11
4 Maine
44
52
2*
3.2
10/28 - 10/30
SurveyUSA
0.46
99.54
16.39
10 Maryland
43
54
2*
4.1
10/27 - 10/29
SurveyUSA
0.28
99.72
27.30
12 Massachusetts
35.9
50.6
2.2*
3.5
9/25 - 10/05
Merrimack
0.00
100.00
24.98
31 New York
39
57
2*
4.0
10/26 - 10/28
Survey USA
0.00
100.00
29.08
4 Rhode Island
41
54
3*
4.1
10/25 - 10/27
Survey USA
0.05
99.95
9.94
3 Vermont
40
53
4*
5.0
10/10 - 10/12
Research 2000
0.32
99.68
153 Electoral Votes
* Nader is not on the ballot.
Calculate the probability of a specific electoral vote scenario, for example a 269-269 electoral tie:
Of the 131,072 possible outcomes, there are 1,538 possible scenarios whereby Bush would receive exactly 81 electoral votes
from the "battleground" states to go with the 188 electoral votes that he has from his "solid" states.
(Kerry would receive the remaining 116 electoral votes from the "battleground" states to go with the 153 electoral votes
that he has from his "solid" states.) The electoral votes would be tied 269-269.
Methodology:
This site is updated as the latest poll results become available - the site is being updated daily.
Data for this site is compiled using the latest poll results from each state and the District of Columbia.
Email: Stephen Delano steve@latestpollresults.com